-

Bitcoin has transformed from a niche experiment into a financial powerhouse, revolutionizing how we store, transfer, and think about money. As the leading cryptocurrency, Bitcoin’s role in 2024 is more significant than ever. Let’s explore its current state, potential, and how you can take advantage of its opportunities. The Bitcoin Basics: Why It’s Still King…
-
Bitcoin continues to dominate headlines as it redefines the way we think about money, value, and technology. This digital currency has transcended its roots as an experimental asset and is now a cornerstone of the global financial system. Whether you’re a seasoned trader or just starting your journey, understanding Bitcoin in 2024 is crucial. What…
-
Bitcoin isn’t just a currency; it’s a paradigm shift in how value and trust are managed in a digital age. Whether you’re an investor, a tech enthusiast, or someone curious about its impact, understanding Bitcoin’s evolution in 2024 is essential. Let’s dive into what makes Bitcoin revolutionary and how you can leverage its potential. The…
-
The Bitcoin story goes far beyond price speculation—it’s reshaping how we think about value, trust, and technology. As we explore its ongoing evolution, here are some powerful reasons why Bitcoin is a cornerstone of the digital financial future. Bitcoin’s Role in Global Finance Bitcoin has become a game-changer in the financial system, particularly in regions…
-
Bitcoin, the world’s first cryptocurrency, remains a revolutionary force in the financial world. As we head deeper into 2024, Bitcoin’s adoption continues to accelerate, driven by growing institutional interest, innovative blockchain applications, and its powerful role as a hedge against inflation. What is Bitcoin? Bitcoin (BTC) is a decentralized digital currency launched in 2009 by…
-
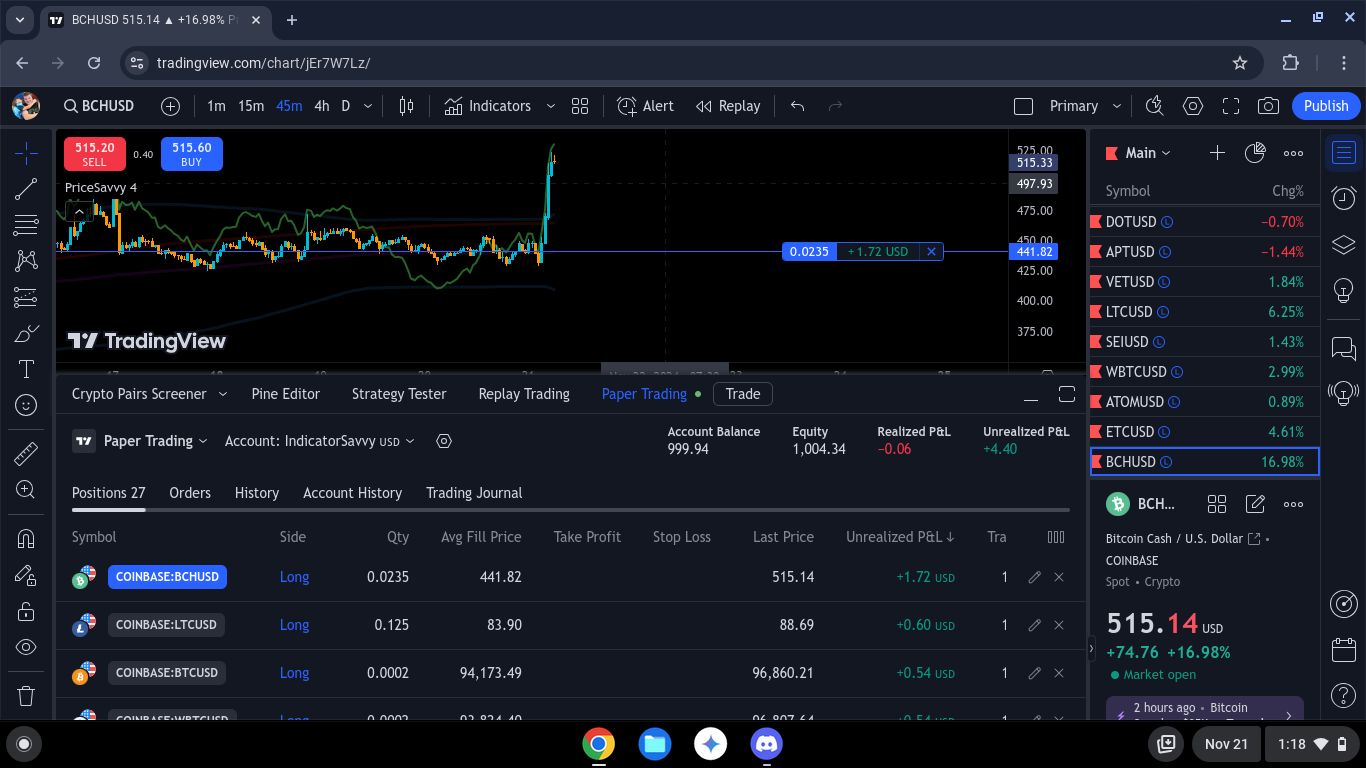
Paper trading is a cornerstone practice for anyone serious about algorithmic or Intellinomic trading and investing. Whether you’re just starting out or a seasoned trader refining your edge, running parallel paper trades alongside live trades is an invaluable strategy. Why? Because it not only hones your alpha but also encourages you to engage in light…
-
Williams %R, developed by Larry Williams, is a momentum oscillator that measures overbought and oversold levels in a market. Unlike other oscillators, Williams %R compares the closing price of a security to its high-low range over a specific period, typically 14 days. By understanding how to use Williams %R, traders can identify potential reversal points,…
-
The Commodity Channel Index (CCI) is a versatile technical analysis tool that helps traders identify cyclical trends in a wide range of markets, not just commodities. Developed by Donald Lambert in 1980, the CCI measures the difference between a security’s current price and its historical average price, providing insights into whether the asset is overbought…
-
Chaikin Money Flow (CMF) is a volume-based indicator that measures the buying and selling pressure over a specified period, typically 20 or 21 days. Developed by Marc Chaikin, CMF helps traders understand whether a security is being accumulated (bought) or distributed (sold) by analyzing both price and volume. By incorporating CMF into your trading strategy,…
-
The Parabolic SAR (Stop and Reverse) is a trend-following indicator developed by J. Welles Wilder, Jr., designed to identify potential reversal points in the price movement of an asset. The Parabolic SAR provides clear buy or sell signals based on the direction of the trend, making it a valuable tool for setting stop-loss levels and…
-
The Ichimoku Cloud, also known as Ichimoku Kinko Hyo, is a comprehensive technical analysis tool that provides insights into support and resistance levels, trend direction, momentum, and potential trading signals—all in a single glance. Developed by Japanese journalist Goichi Hosoda in the late 1930s, the Ichimoku Cloud might seem complex at first, but with a…
-
On-Balance Volume (OBV) is a technical indicator that uses volume flow to predict changes in stock prices. Created by Joseph Granville in the 1960s, OBV is based on the idea that volume precedes price movement, meaning that significant changes in volume can often signal upcoming price shifts. By understanding and applying OBV, traders can gain…
-
Fibonacci Retracement is a popular technical analysis tool used by traders to identify potential levels of support and resistance in the price of an asset. Based on the Fibonacci sequence—a series of numbers where each number is the sum of the two preceding ones—Fibonacci Retracement levels are derived from the mathematical relationships between the numbers…
-
The Average True Range (ATR) is a widely used technical indicator that measures market volatility. Unlike other indicators that focus on price direction, the ATR is all about understanding the magnitude of price movement. It’s particularly useful for setting stop-loss levels, gauging the strength of a move, and identifying potential breakout points. By understanding how…
-
The Stochastic Oscillator is a popular momentum indicator that helps traders determine whether an asset is overbought or oversold. Unlike other indicators that focus solely on price, the Stochastic Oscillator compares a security’s closing price to its price range over a specific period, providing insights into potential reversals or trend continuations. While it’s commonly used…
-
Bollinger Bands are a versatile and widely used technical analysis tool that helps traders understand market volatility and potential price movements. Created by John Bollinger in the 1980s, these bands can be used to identify overbought and oversold conditions, gauge the strength of trends, and even predict potential breakout opportunities. To fully utilize Bollinger Bands,…
-
The Moving Average Convergence Divergence (MACD) is one of the most popular and versatile tools in technical analysis. It’s a trend-following momentum indicator that helps traders identify potential buy and sell signals, spot changes in the strength or direction of a trend, and even foresee potential reversals. To fully leverage the power of the MACD,…
-
Moving averages are one of the most fundamental and widely used tools in technical analysis. They help traders and investors smooth out price data, making it easier to identify the direction of a trend. Whether you’re new to trading or a seasoned market participant, understanding how to use moving averages can greatly enhance your market…
-
The Relative Strength Index (RSI) is a widely used momentum indicator that helps traders and investors assess the strength of a market’s price movement. It’s particularly valuable in identifying potential overbought or oversold conditions, which can signal possible price reversals. But to truly harness the power of the RSI, it’s crucial to understand not just…
Share our blog with your colleagues.
We work hard to keep it updated.
What You’ll Find:
- Tutorials
- Analysis and News
- Culture and Tech
- Math and Economics
How to Navigate:
Use the search function to find things like “Relative Strength Index” or “RSI.”